Analytics shows how your agents perform, what visitors ask, and how your connected APIs behave. Use the filters at the top to pick All agents or one agent, and a period: Last 7 days, Last 30 days (default) or Last 90 days.
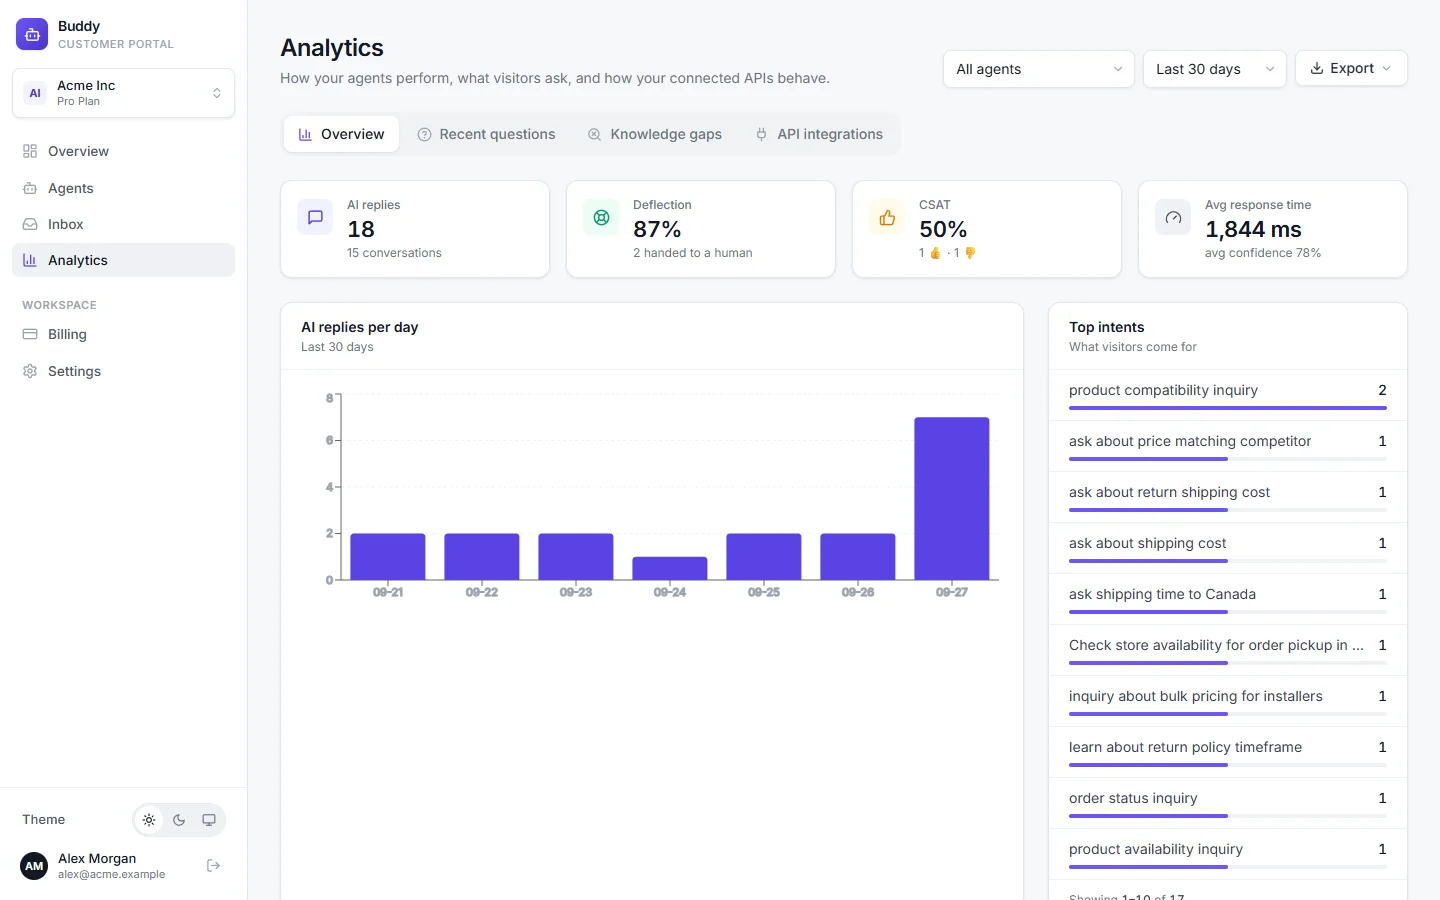
Overview
- AI replies
- How many answers the AI sent, and in how many conversations.
- Deflection
- The share of conversations that didn't end up with a human. Higher means the AI resolved more on its own.
- CSAT
- Thumbs up as a share of all thumbs up and down that visitors gave answers.
- Avg response time
- How quickly the AI answered on average, with the average confidence below it.
Below the metrics you'll find AI replies per day, Top intents (what visitors come for, ranked), and totals for Navigation actions (pages the agent opened for visitors), Avg confidence and Hand-offs.
Answer quality
The Answer quality card scores each agent from 0 to 100: Good (80+), Fair (60–79) or Needs work. The score weighs confident answers at 70% and visitor thumbs at 30%. It also shows:
- Confident
- Replies with at least 50% confidence.
- Fallback
- Replies where nothing relevant was found and the fallback message was sent.
- Thumbs
- Visitor feedback on answers.
- Open gaps
- Groups of unanswered questions, with a link to answer them in Knowledge gaps.
Recent questions
Everything visitors asked, newest first. Click View conversation to open any of them in the inbox. It's the quickest way to learn how customers phrase things, which helps when you write Q&A pairs and intents.
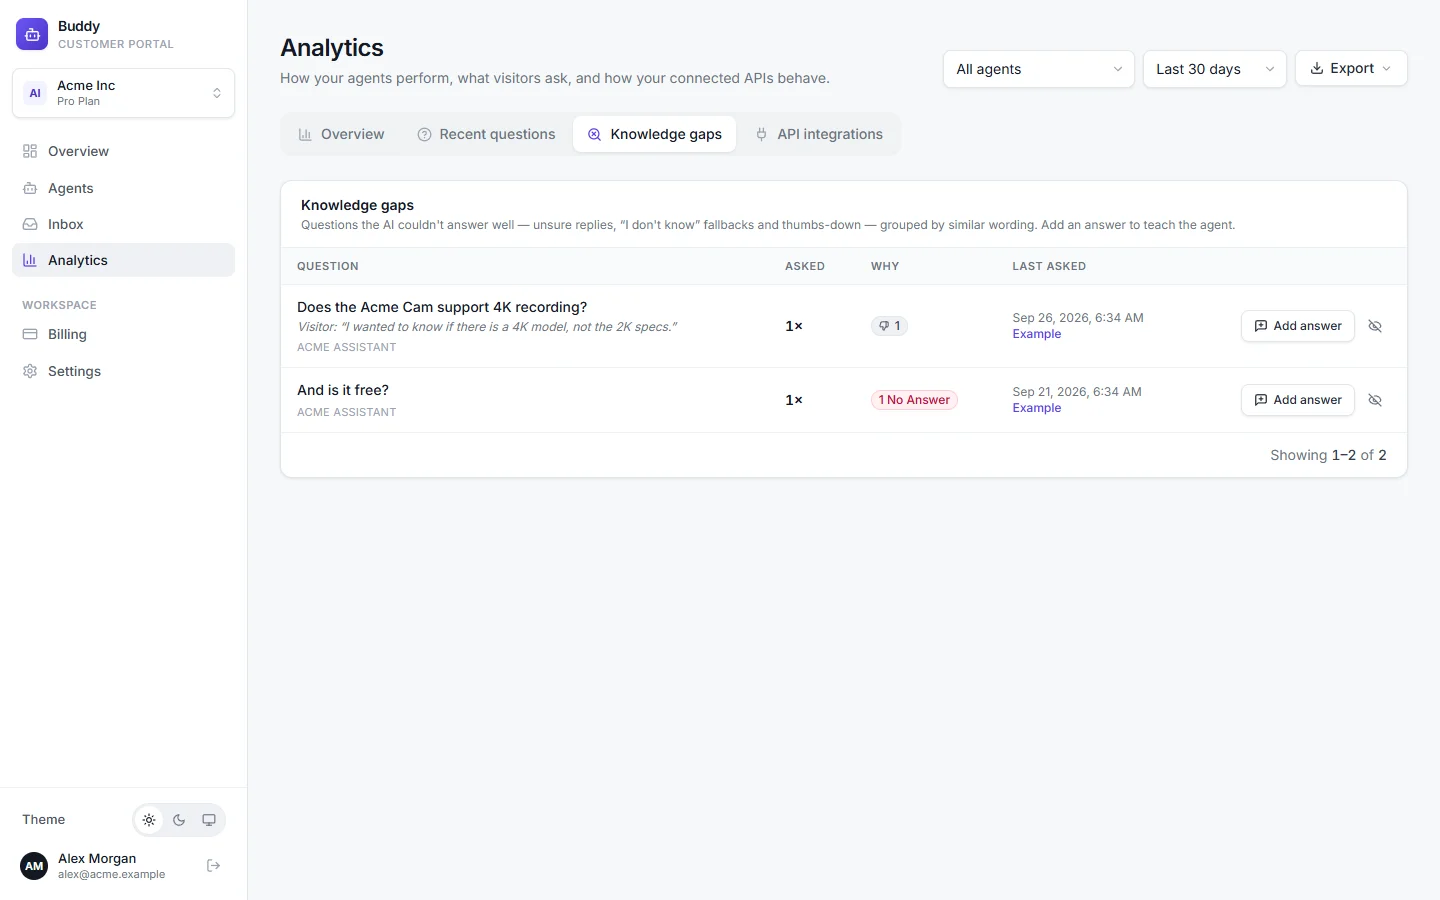
Knowledge gaps
Questions the AI couldn't answer well, grouped by similar wording. Add an answer and the agent uses it from then on. The full workflow is in Answer bank and knowledge gaps.
API integrations
If your agent uses API actions or pushes leads to your API, this tab shows how those calls performed:
- API calls
- Total calls, split into calls the AI made during chats and contact-form pushes.
- Success rate
- Green at 98% or more, amber at 90% or more, red below that.
- Failed calls
- With details under Recent failures.
- Avg response time
- Average and 95th-percentile latency.
By integration breaks this down per API, with calls, success rate, latency, last call and last error. Who made the calls separates AI in chat, Auto push, Manual resend and Test. Test calls are left out unless you tick Include test calls.
Export to Excel or CSV
Every tab has an Export button. Choose Excel (.xlsx) for a formatted workbook with filters on every column, or CSV (.csv)for Google Sheets, CRMs and scripts. The export covers the selected agent and period:
- Overview: a summary, AI replies per day and top intents.
- Recent questions: every question, up to 50,000 rows.
- Knowledge gaps: the gap groups and the individual questions.
- API integrations: a summary, per-integration stats, calls per day and recent failures.
Troubleshooting
›Everything shows zero
Check the agent and period filters. Numbers only appear once visitors are chatting with your live agent.
›CSAT is empty
CSAT needs visitors to give answers a thumbs up or down. It stays empty until someone does.